SUN
tan
LESSON 4.1
Right Triangle Trigonometry

LESSON 4.4
Graphing Trigonometric Functions
Lesson Overview:
graphing cos, sin and identifying Parent function, domain, range, symmetry, x-intercept, y-intercept, and max & min.
a. Sine Function
b. Cosine Function
Part A: Graphing Sin Functions
The Parent sine function is f (t) = sin(t).
This function has an amplitude of 1 because the graph goes
one unit up and one unit down from the mid-line of the graph.
This function has a period of 2π because the sine wave
repeats every 2π units.
Part B: Graphing Cotangent Functions
y=cos(x)
Graphing Trig Functions on the SAT
First, let's use the given information to determine the function's amplitude, mid-line, and period.
Then, we should determine whether to use a sine or a cosine function, based on the point where x=0, equals, 0.
Finally, we should determine the parameters of the function's formula by considering all the above.
The mid-line intersection is at y=3 so this is the mid-line.
The maximum point is 4 units above the mid-line, so the amplitude is 4.
The mid-line intersection is 3 units to the right of the maximum point, so the period is 12.
Since the graph has an extremum point at x=0, we should use the cosine function and not the sine function.
a=4, d=3, b= π/6
answer: y= 4cos (π/6* x) +3
Graphing Trig Functions in the Real World
Conclusion:
In order to graph trigonometric functions you first must identify the amplitude (how far up and down the graph covers) and the period of the function which is how many units a single wave is.
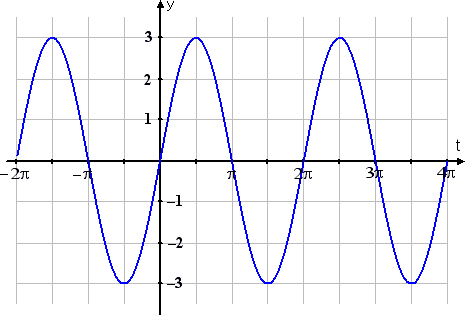
g(t) = 3sin(t)
The second graph is three times as tall as our parent function. The amplitude has changed from 1 to 3 .Whatever number A is multiplied on the trig function gives you the amplitude (that is, the "tallness" or "shortness" of the graph); in this case, that amplitude number was 3.
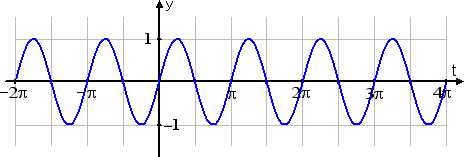
h(t) = sin(2t)
This third graph is squished in from the sides compared to the first graph and the sine wave is appearing twice as much. This relationship is always true: Whatever value B is multiplied on the variable (inside the trig function), you use this value to find the period.
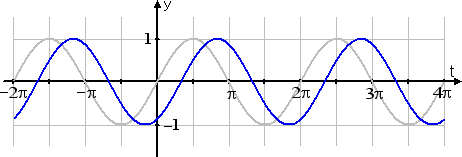
j(t) = sin(t – π/3)
The blue graph is shifted over π/3 units from the regular graph. The graph is shifted to the right or left by that number of units This right- or left-shifting is called "phase shift".

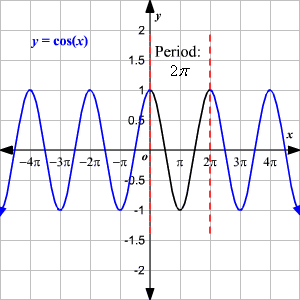
Properties of the Cosine Function, y=cos(x)y=cos(x) .
Domain : (−∞,∞)(−∞,∞)
Range : [−1,1][−1,1] or −1≤y≤1−1≤y≤1
yy -intercept : (0,1)(0,1)
xx -intercept : (nπ2,0)(nπ2,0) , where nn is an integer.
Period: 2π2π
Continuity: continuous on (−∞,∞)(−∞,∞)
Symmetry: yy -axis (even function)
The maximum value of y=cos(x)y=cos(x) occurs when x=2nπx=2nπ , where nn is an integer.
The minimum value of y=cos(x)y=cos(x) occurs when x=π+2nπx=π+2nπ , where nn is an integer.
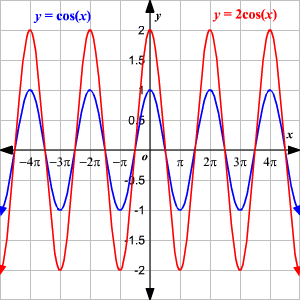
y=2cos(x)
Compare the graphs.
For the function y=2cos(x), the graph has an amplitude 22 .
Since b=1, the graph has a period of 2π2π .
Thus, it cycles once from 0 to 2π with one maximum of 2, and one minimum of −2 .
_PNG.png)